Here are some sample work products from previous Venture724 client engagements…
Core Diagram One page diagram showing the complete end-state definition for the full enterprise operation, serving as the guiding vision for the organization around which the management team can rally. Each shape represents a capability to be developed within a core functional area, and each shape has individual meaning in conjunction with its relative position to other nearby shapes. Usually accompanied by the Core Story which provides a narrative for the Core Diagram.
Core Diagram – Click to Enlarge
Process Map A classic technique of visually diagramming the flow of work activities, handoffs, system components, decisions, document handling, and workflow between roles in a process internally and/or externally. There are supposed to be two versions for every functional area… an As-Is version and a To-Be version. Opportunities for improvement are identified and marked with triangles before they get logged into another relevant work product namely the OFI Catalog.
Process Map – Click to Enlarge
OFI Catalog (Opportunities for Improvement) As information is collected in our client working sessions, the current workflow is analyzed to identify “OFIs” aka Opportunities for Improvement. OFIs both large and small are then captured into the MS-Word document and prioritized. OFIs are marked in the As-Is Process diagrams with triangles and subsequently assessed in terms of both their impact or frequency and can be quantified to the degree that is necessary for potential efficiency savings, revenue opportunities, or better customer experience. The far right column shows initial suggestions for how to solve for each OFI or how to improve it in the To-Be Process Definition being formulated.
OFI Catalog – Click to Enlarge
Best Practices Capability Model Through this capability model describing CE724’s Best Practices, we and the client can match up on what the shared understanding should be of a rigorous criteria for operational process success in the client’s particular environment. Using our Best Practices to guide, we leverage the end-state vision work products including the Core Diagram, the opportunities for improvement, and CTQs (critical to quality factors) to redesign the process still using a role-based approach. This will provide the best and lasting future state definition from which system requirements naturally reveal themselves.
Best Practices Capability Model – Click to Enlarge
ERP and CRM Functional Solution Assessment System Solution Scenarios are broken out from within the high-level To-Be Process definition to envision how various solutions could work in covering the core functional needs, the essential user and system workflows, screen definitions, database interactions, departmental hand-offs, and reports. This work product enables the subsequent detailing out of deeper automation views in the To-Be Process.
ERP and CRM Functional Solution Assessment – Click to Enlarge
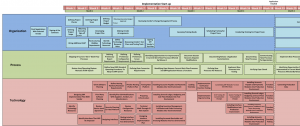
Ops/IT Implementation Roadmap People, Process, and Technology Coordinated. This is an implementation roadmap for the management team and organization to rally around, including the steps necessary in the areas of People, Process and Technology on a weekly or monthly basis over the next 6, 12, 18 months for execution. System and Non-System steps are shown, and the implementation roadmap for the upcoming few years is included as well at a high-level to provide the path forward longer term.
Implementation Roadmap – Click to Enlarge
Analytics Dashboard Development To achieve great performance management by design, we utilize our process depth on your key Metrics which drive the business and then we detail out how your existing data can be leveraged with Analytics. We apply just enough project management structure from our creating strong specifications through the “build” stage to implement the customized dashboard into production. Our hands-on software development and integration work always includes full application specifications with all of the underlying business intelligence logic, all screen/sub-screen wireframes, dataflow rules, and database table design going all the way down to field-by-field instructions. Our approach enables your internal IT staff to take it over from us and maintain it with proper documentation which we provide.
Analytics Dashboard Development – Click to Enlarge